Assignments
Problem Set 4
Due 11/9, by the start of class.
R practice: World Development Indicators, take 2
This week, you’ll keep working with the World Development Indicators from last week, starting your own R markdown file to complete the following steps.
- Load the wdi data from last week and the world spatial data from
rnaturalearth(like we did in class) - For the world data, remove Antarctica (remember, you can use tidyverse functions on a SF object). Antarctica has
iso_a2 == "AQ" - Compare the country codes across the two world and wdi data sets to see if there are codes in only wdi or only world. First, see if there are values only in wdi like so
wdi %>%
  group_by(iso2c) %>% # wdi has multiple obs for each country, we only want one
  slice(1) %>%
  select(iso2c, country) %>% # to print just the codes and country names
  filter(!(iso2c %in% world2$iso_a2)) # are iso2c values found in the world data
Then check if there are values only in world.
- (Left) join one year of the wdi data to world (pick a year).
- Create a choropleth map for the world using a variable of your choice from the wdi data (using the default projection, World Geodetic System 1984)
- Create the same map using a different projection
Problem Set 3
Due 11/2, by the start of class.
R practice: World Development Indicators
This week, you’ll use a small subset of variables from the World Bank’s data.worldbank.org obtained using the WDI package. To prep the data, download (or copy) the ps3_prep.R script into a folder you’ll use for the problem set and run it.
This week’s work should be submitted as an R markdown file (though you are free to use a regular ol’ R script to work out your code before adding it to the markdown file, if you like); this file should be knittable by me assuming it is placed in a folder with the data in a data subfolder.
Copy the contents of the ps3.Rmd file into an R markdown file and name it: lastname_ps3.Rmd. Complete the tasks as described in the file and save (and knit). You’ll submit the completed Rmd file to me on slack (via direct message) – just the .Rmd file.
Your Data
Last week you began validating and cleaning at least two key variables to work with for the final project and began visualizing their distributions. This week, add
- A cleaning script that contains any code for data cleaning, preparation, derivation, and wrangling that you’ve written so far and saves a “cleaned” version of your data. If there’s wrangling you’d like to do but are struggling with, make a comment in this script and I’ll have a look.
- An R markdown script that reads in the cleaned data, begins to add exposition to the work (explaining the questions, the variables, etc.), and generates at least one visual beyond the univariate distributions you submitted last week. If there is something you’re hoping to do this visual – either something you haven’t made work yet or something we haven’t talked about yet – add an explanation in the prose and I’ll have a look.
Send me both the cleaning script and the R markdown files via slack.
Good Data Visualizations
Still thinking about Cairo’s criteria for good data visualization (truthful, functional, beautiful, insightful, enlightening) and/or Healey’s negative criteria (aesthetics/bad taste, substantive/bad data, perception/bad perception), find a data visualization you think is especially “good” and post it to the slack channel “goodviz-badviz” with a brief explanation of what you think it does well (this is a chance to learn from one another). The Visualization Inspiration links on the resource page might help.
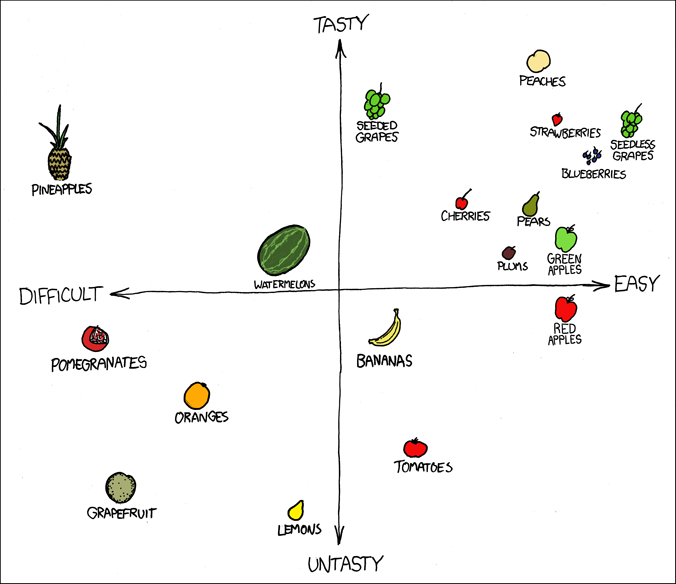
xkcd inspiration
Problem Set 2
Due 10/26, by the start of class.
R practice: Birthdays
This week, you’ll use birth dates data collected by FiveThirtyEight. Have a look at the linked GitHub page so you understand what variables are included.
Download the ps2.R script and name it: lastname_ps2.R. Complete the tasks as described in the script and save. You’ll submit the completed script to me on slack (via direct message). I should be able to run the script as is (line by line) with no errors.
Your Data
Last week you identified a data set to work with for the final project and began to examine it. Add a new script to your project folder that
- Select two key variables you expect to be useful in the final visualization (you identified some key variables last week, but feel free to revise or update). Do either of these variables require additional cleaning/preparation (e.g., reformatting, filtering, recoding, re-leveling factors, mutating, etc.)? If so, add code to begin that cleaning. Either way, there should be some commands that I can follow to see how you checked that these two variables were structured in a reasonable way.
- Visualize the (univariate) distribution of these two variables in at least two different ways. Practice adding titles (and subtitles or captions), axis labels, legend titles, etc.
Share this new script with me on slack. It should be written so that I can add it to the project folder you shared with me last week and run it.
Bad Data Visualizations
Thinking about Cairo’s criteria for good data visualization (truthful, functional, beautiful, insightful, enlightening) and/or Healey’s negative criteria (aesthetics/bad taste, substantive/bad data, perception/bad perception), find a data visualization you think is especially “bad” and post it to the slack channel “goodviz-badviz” with a brief explanation of how you think it serves as an example of a poor data visualization (this is a chance to learn from one another). The Visualization Inspiration or Anti-Inspiration links on the resource page might help.
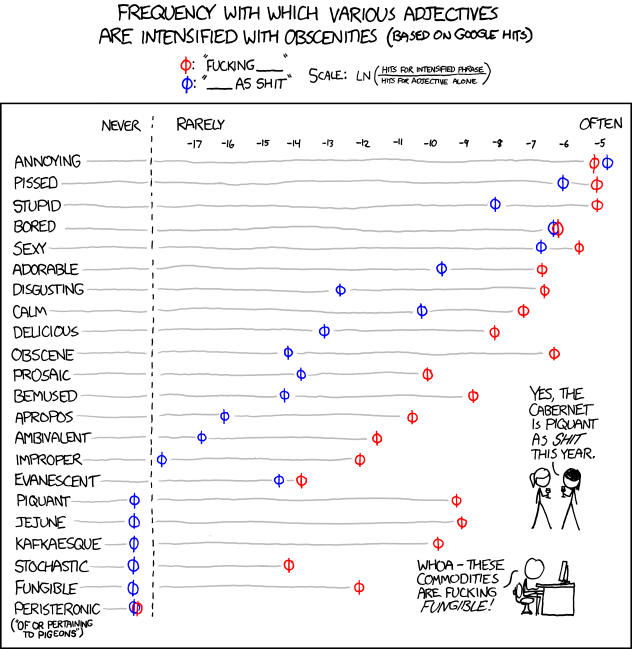
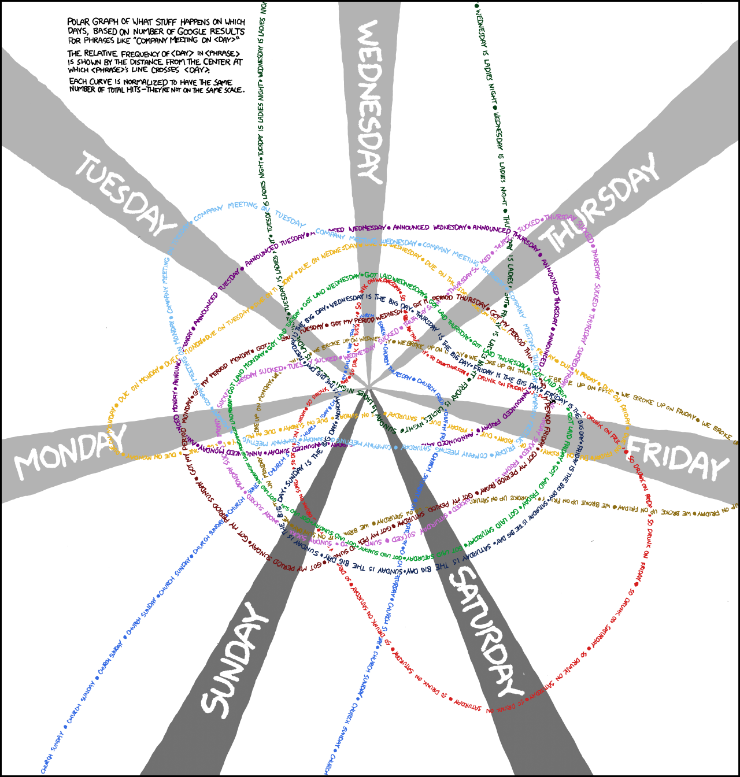
xkcd inspiration
Problem Set 1
Due 10/19, by the start of class.
R practice: playing with legos!
Download the ps1.R script and name it: lastname_ps1.R. Complete the tasks as described in the script and save. You’ll submit the completed script to me on slack (via direct message). I should be able to run the script as is (line by line) with no errors.
Find data
Identify a data source you’d like to use for the final visualization. I’ve provided links to a variety of sources to help you out. The data can be anything that interests you!
Part of each week’s work will be using the chosen data set. To make our exchanges around this individual work easier, create a folder that contains the chosen data, an .Rproj file, and the weekly scripts you create using the data. You’ll zip this up and share it with me so that I can follow/review your work.
For the first week, create a script that
- Reads in the data
- Examines the data using some of the functions in PS 1, Question 2
- Via comments (#), note the likely key variables of interest
Your comments don’t need to foreshadow everything; just start getting familiar with the data set and be thinking about some possible questions you might ask of it.
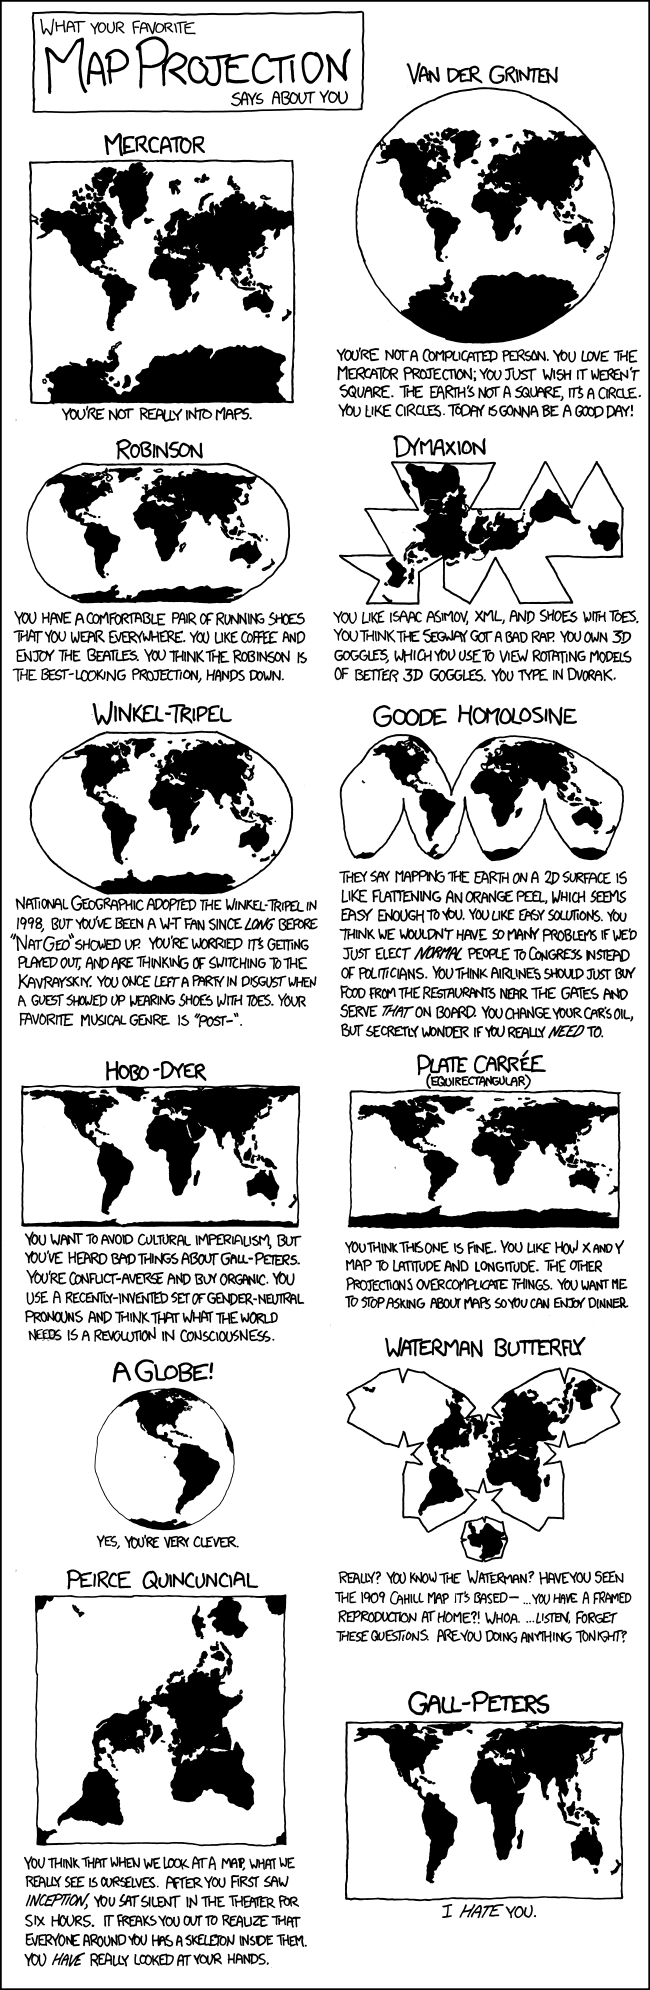
xkcd inspiration